Log Visibility with Elasticsearch + Windows Event Forwarding

After months of wanting to do this, I’ve finally had the chance to tackle log collection in our organization. While the initial goal was simply offloading security logs from company servers to a centralized collector, I’ve been able to configure a basic implementation of Elasticsearch and Kibana on top of Windows Event Forwarding for visualization. This should give our organization better insight into potentially malicious activity using Kibana’s front-end visualization vs just scrolling through logs in Windows Event Viewer.
The way I set this is up pretty simple. I created a Server 2019 Core (headless) VM configured as a Windows Event Collector, and configured forwarding servers via Group Policy to send specific events (based on event ID) to the collector server. I then installed ElasticSearch, Kibana, and WinLogBeat on the collector server and set it to forward everything in the “Forwarded Events” log to ElasticSearch. In an ideal scenario, we would have load-balanced Kibana and ElasticSearch between a couple of servers or via Kubernetes, but for now this isn’t mission-critical service so we decided to keep a small footprint.
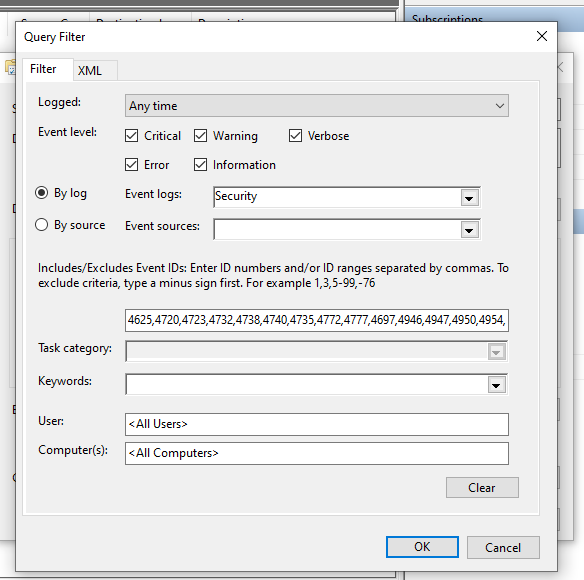
I started this project by configuring Windows Event Forwarding. There’s two ways of doing this – either source-initiated or collector-initiated. While collector-initiated might sound like the simplest way to do it, this method only lets you specify the individual computer objects you want to collect from – you can’t specify by security group. With a source-initiated setup, you CAN specify a security group (of computer objects) which will make management much easier when you add new servers. So to create the subscription, log into the server, open the Windows Event Viewer MMC, and select the “Subscriptions” item in the nav pane on the left. Windows should prompt you to turn on the Windows Event Collection service at this time (make sure to click ok to enable that). Create a new subscription, select “Source-Initiated”, and then select the group (with computer objects in it) that you want to collect events from. Finally, select the events you want forwarded and click ok to create the subscription.
Note that if your collector is a Windows Server Core computer like mine, it won’t have MMC built in. I had to create the subscription on my local computer, export it to an XML file via wecutil, remove the first line of the XML output, and then import it on the Core server using wecutil create-subscription. You can learn more about the wecutil commandlet here.
The next step is to configure the forwarding computers. If you have more than a couple of computers you want to forward from, Group Policy is the way to do it. I followed this excellent guide from AdamTheAutomator to set this up. Once complete, you should start seeing events populate in the “Forwarded Events” log on the collector server. If not, try reducing the number of events specified in the comma-separated list of event-id’s to collect. If you specify a lot of different event id’s in the “Events to collect” field, it can actually break the forwarding (it took me a while to figure this out).
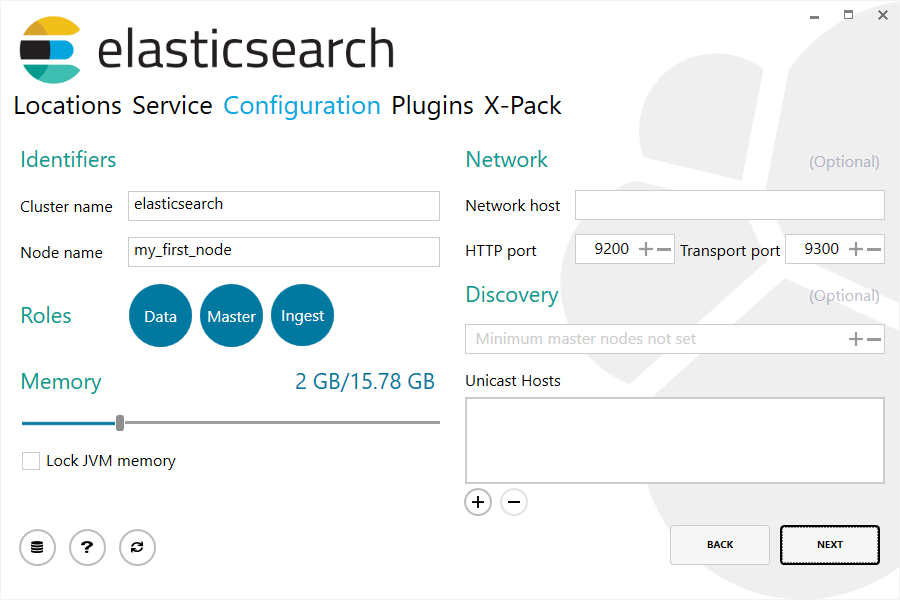
Once I got events forwarding from member servers, I installed Elasticsearch, Kibana, and Winlogbeat on the collector. If you’re installing Elasticsearch on a Windows server like me, you can use the MSI installer provided by Elastic for a quick, clean, and easy installation. Download and launch the MSI, click next a few times, and voila – everything is installed under Program Files and Program Data. There is a step in the installation wizard which allows you to change the default memory allocation of the Java Virtual Machine, http port, and other parameters if you choose.
With Elasticsearch installed, I then installed Kibana. I used the traditional method of extracting the provided zip archive and configuring settings via the Kibana.yml configuration file. While there are many settings you can configure in this file, I only had to change a few to get up and running. First, I had to change the “server.host” line to the IP address of the server. There are also three lines to modify to enable SSL (https) for the Kibana http server client connection which enable SSL and specify the path to the SSL certificate and private key. You’ll obviously need the corresponding SSL certificate (.crt) and .key file (unencrypted) placed on the server in the directory specified. After making these modifications to the Kibana config file, I also had to make add a TCP ALLOW rule to the firewall for port 5601 (the default Kibana http port). With these steps completed, you should be able to navigate to https://[server_ip_or_hostname]:5601 and reach the Kibana web console.
At this point, you have your member servers sending Windows Events to the collector server, Elasticsearch is listening on port 9200, and Kibana is up and running, ready to show your events. However, we still need to install Winlogbeat on the collector server so that it can take the events in the Forwarded Events log and provide them in a format which Elasticsearch can ingest. To do so, download the Winlogbeat.exe file from Elastic and install it on the collector. Once complete, you should be able to add the log collector server as a Windows Event Forwarding source in Kibana. Note that the default configuration for Winlogbeat is to send events from all five of the major event logs (Application, Security, Forwarded, etc). If you only want Winlogbeat to send events in the Forwarded Events log (forwarded from other servers) to Elasticsearch, you’ll need to remove the entries for the other logs in the Winlogbeat.yml config file.
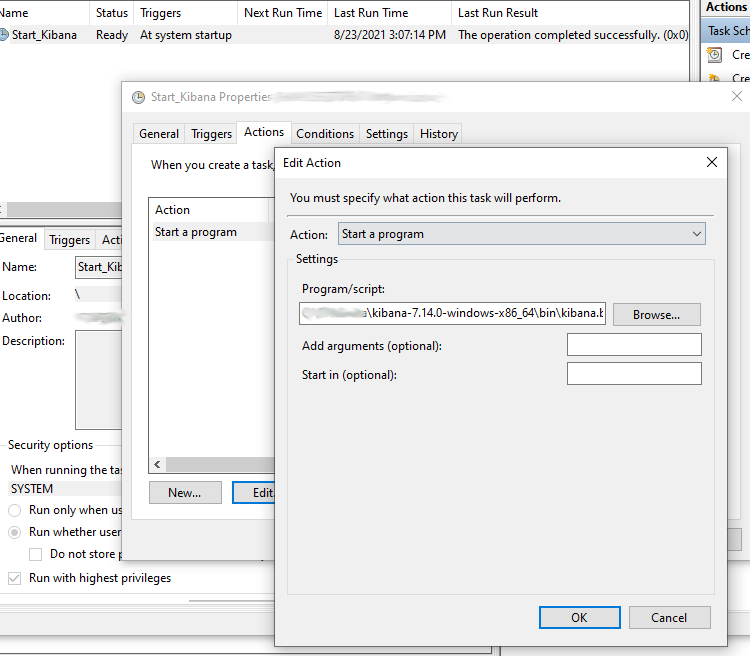
Another important step I did for this was to create a scheduled task to launch Kibana on startup. By now, you’ve seen that the Kibana server starts by executing the Kibana.bat file and runs in the foreground in your terminal window. I simply configured a scheduled task to run that batch file on startup under the local “System” account. Elasticsearch runs as a Windows service so it should automatically start when the system starts.
The final step is to configure the x-pack security features for Elasticsearch. In order to secure the Kibana console with a username and password, as well as configure SSL communication between nodes if you have multiple nodes, you’ll need to follow the Set up minimal security for Elasticsearch and Set up basic security for the Elastic Stack documentation pages from Elastic. It might look complex at first, but these pages outline each step clearly, and you should be able to configure these settings relatively quickly. At a high level, the steps are as follows:
- Run a couple of included scripts to generate random passwords for the built-in service accounts (save these!) and add those passwords to the secure vault.
- Create a Certificate Authority on one of your nodes (or your only node) and generate some certs.
- Copy the node certs to each (or only) node.
- Add some lines to the Elastic.yml config file to enable SSL transport, client authentication, etc.
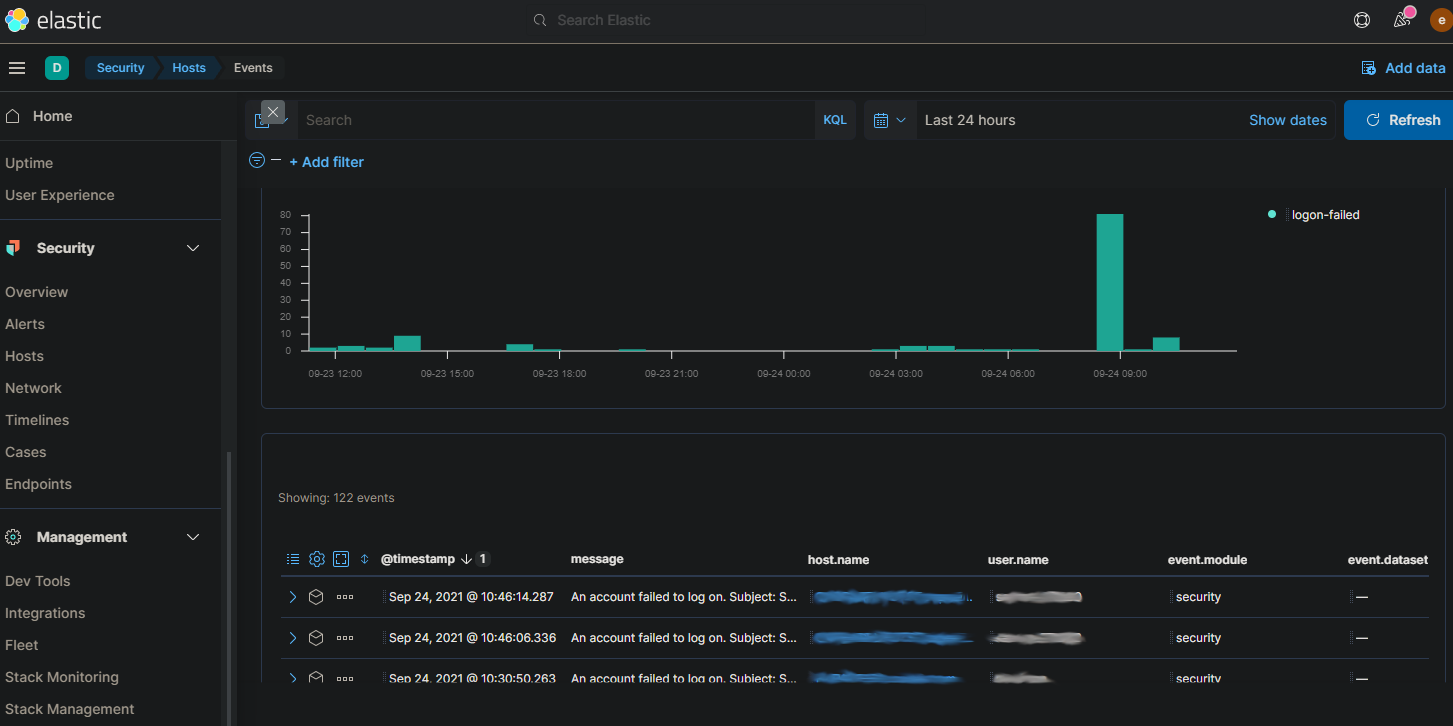
When you’re done, you should be able to navigate to your Kibana URL, sign in with the “elastic” user, and see your incoming Event Log Events under “Security” > “Hosts”. You can also create additional user accounts within “Management” > “Stack Management”.
Note that this is a bare minimum installation of Elasticsearch. There are a ton of additional features you can configure including SAML authentication, Alerts, Endpoint Protection, etc. However, I hope this helps someone at least get started with sucking in forwarded Windows Events to Elasticsearch and putting a basic front end on all of those alerts. I plan to do another post on some of these additional features in the future – stay tuned.